An analysis of Twin Cities real estate data for the month of May found that while the housing market is continuing its recovery from the great recession, it remains plagued by a low inventory of homes for sale.
Each month the Shenehon Center for Real Estate at the University of St. Thomas’ Opus College of Business looks for real estate trends in the 13-county Twin Cities region and tracks the median price for three types of sales: nondistressed or traditional; foreclosures; and short sales (when a home is sold for less than the outstanding mortgage balance).
“The main story found in data for May is a significant increase in the number of traditional-type home sales and a continuation of the historically low number of homes available for sale,” said Herb Tousley, director of real estate programs at the university.
The number of homes for sale in the Twin Cities in May was 16,282. Normally there are between 20,000 and 25,000 homes on the market. On top of that, the 5,264 nondistressed homes sold in May 2015 was 25 percent more than in May 2014.
This combination of more sales and fewer homes “has created a seller’s market with instances of multiple offers and homes selling for more than the asking price becoming more common,” Tousley said.
Why are there fewer homes on the market?
“There are many homeowners who are considering selling now that values have recovered over the last three years. The question then is, what they do after they have sold their home. They have now turned from sellers into buyers in a market that offers them limited choices for their replacement home and the fact that obtaining a new mortgage is still relatively difficult,” Tousley said.
“The other reason is that although the number of homeowners who are underwater has decreased significantly there are still a considerable number of homeowners who are near negative equity. That means that even though they are not underwater they have very little equity and when they sell their home they do not have enough equity to buy a new home.
“These factors along with more restrictive credit standards and little-to-no wage growth in the last several years are keeping many potential sellers on the sidelines.”
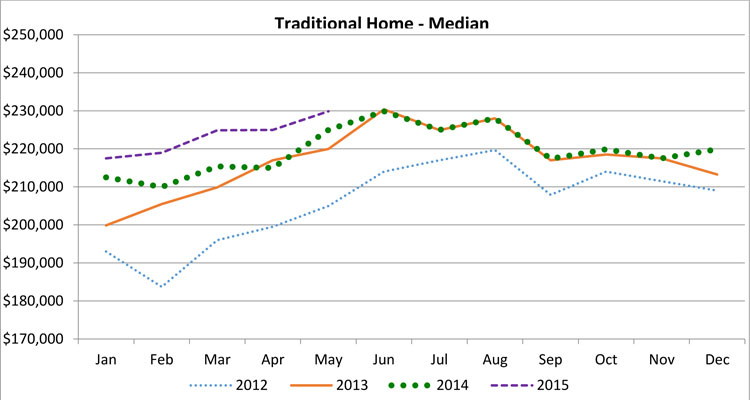
The median sale price for a traditional or “nondistressed” home in May was $229,900, up 2.18 percent from April’s $225,000.
“Originally, we had been expecting an annual median sale price increase in 2015 of 4 percent to 6 percent. However, if the current trend of strong sales numbers and a persistently low inventory of homes for sale continues through the summer and into the early fall, we expect to see higher-than-expected increases in median sale prices,” Tousley said.
Overall, how is the market doing?
To answer that question, the Shenehon Center tracks nine data elements each month, including the median price for three types of sales (traditional, foreclosure and short sales) and creates an index for each. The St. Thomas Traditional Sale Composite Index hit 1109 in May, which is the highest level seen since the index was created in 2005. The index increased 2.8 percent from April 2015 to May 2015, and it increased 5.6 percent from May 2014 to May 2015.
“The continued increase in the Traditional Sale Composite Index is an indicator of the ongoing improvement in the health and resurgence of the Twin Cities housing market,” Tousley said.
Things also are continuing to look better for the two “distressed sales” indexes. In May, the short-sale index increased 5.1 percent from a year ago, and the foreclosure index moved up 5.6 percent. Several years ago these two indexes represented a significant portion of the all home sales in the Twin Cities. In May, short sales were just 3.1 percent of the total while foreclosures were 8.6 percent.
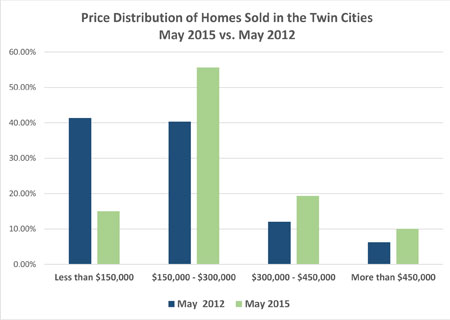 St. Thomas researchers did find some interesting results when looking at changes in the number of homes sold at different price levels. For example, three years ago, in May 2012, 40 percent of homes sold for less than $150,000. But in May 2015, less than 15 percent of the homes sold for less than $150,000. Meanwhile, the number of homes that sold for more than $450,000 in May 2015 is nearly double what it was back in May 2012.
“This shift is a reflection of the high number of foreclosures three years ago as well as the general decline in the value of all homes during the crash. Moving to 2015, as we are recovering from the recession, the economy is beginning to improve and home values are increasing,” Tousley said.
He added that this trend is expected to continue, but the differences will not be as stark as the market continues to stabilize over time.
More information online
The Shenehon Center’s charts and report for May can be found here.
The index is available free via email from Tousley at hwtousley1@stthomas.edu.