The Twin Cities remains near the top of the list of affordable housing markets in the United States, according to an analysis conducted by the Shenehon Center for Real Estate at the University of St. Thomas’ Opus College of Business.
Each month the center tracks the median price for three types of sales in the 13-county Twin Cities region: nondistressed or traditional; foreclosures; and short sales (when a home is sold for less than the outstanding mortgage balance). In addition, it looks for trends in the market and creates a monthly composite index score by tracking nine data elements for those three types of sales.
Herb Tousley, director of real estate programs at the university, credits “continuing strong housing-market fundamentals and above-average wage growth thus far in 2015” for keeping the Twin Cities near the top of affordable-housing lists.
“According to Forbes, household income growth in the Twin Cities in 2014 was 1.9 percent. Based on our improving local economy and low unemployment rate, we are expecting household income to grow 2 percent to 2.5 percent in 2015,” Tousley said. “That means that household incomes and median home sale prices are increasing at nearly the same rate so in terms of real dollars home prices are keeping up with inflation.
“This is not the case in many major metro areas around the country. In May 2015 the average apartment rent in the Twin Cities market had increased to just over $1,200. Home ownership in the Twin Cities remains an affordable option for many since a household that is earning the median annual household income can afford to purchase a home selling at the median sale price in our market.”
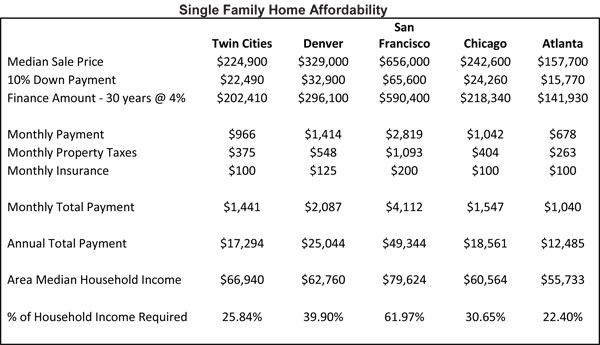
Here are five examples of single-family-home affordability from around the country (details are available on the Shenehon Center website):
Key numbers for August.
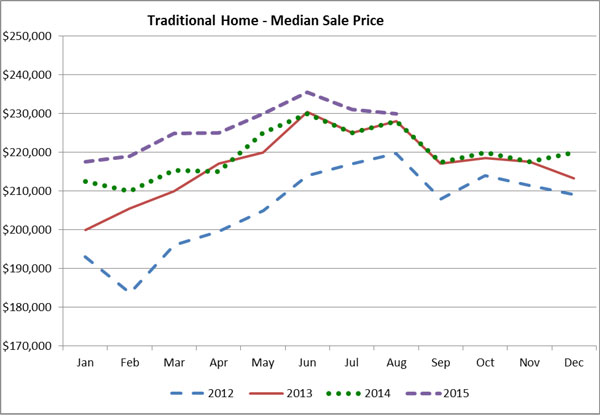
The median sale price of traditional-sale home in August 2015 was $229,900; that’s down .48 percent from July 2015’s $231,000 and up .83 percent from August 2014’s $228,000.
The median sale price of a short-sale home in August 2015 was $163,500; that’s up 6.2 percent from July 2015’s $153,950 and up 2.19 percent from August 2014’s $160,000.
The median sale price of foreclosure-sale home in August 2015 was $149,900; that’s up 8.62 percent from July 2015’s $138,000 and down 1.07 percent from August 2014’s $151,525.
In August 2015, 7.68 percent of sales were “distressed” (foreclosures or short sales). That compares to 10.57 percent in August 2014.
Closed sales and low inventory.
The number of closed sales in August was 5,836, down from July’s 6,363. “This decrease is part of normal market seasonality as sales activity slows down as we move into fall,” Tousley said. “The encouraging part of this is that despite the decrease it represents an 8.1 percent increase over the August 2014 closed-sales volume.”
The number of homes for sale remains historically low. In August 2015 there were 2.8 homes available for sale for every home sold. In August of 2014 there were 3.5 homes available for sale for every home sold. And in August 2006 there were 6.3 homes for sale for every home sold.
There were 6,923 new listings in August 2015, down 13 percent from July and unchanged from the level recorded in August 2014. “That tells us that low levels of homes available for sale will persist in the short run. In the meantime, the low number of homes for sale and the higher volume of closed sales are being reflected in lower time on the market, a higher number of multiple offers and sale prices at more than the original asking price,” Tousley said.
Continued Lag in New-Home Construction
A source of additional single-family housing is the construction of new homes, but so far this year, Tousley said, “the number of single-family housing starts has failed to live up to many homebuilder’s expectations.”
Based on the number of construction permits issued through August (3,202), the Twin Cities is on track to have about 5,000 new homes built or under construction in 2015. That’s about the level of new construction in 2014, but less than in 2013. That compares to the early 2000s, when the number of building permits was running at 8,000 to 10,000 per year.
“The level of new-housing starts is going to have to increase considerably to make a significant contribution toward increasing the number of homes available for sale in our market,” Tousley said.
The cost of new single-family homes is clearly on the rise in the Twin Cities. In the late 1990s and early 2000s, before the market crash, nearly half the new homes sold for less than $250,000. In the last two years, less than 20 percent of the new homes sold for less than $250,000. Much of this increase, Tousley said, is due to higher land prices, development costs and building materials.
The average price of a new home is running about $100,000 more than the median price of an existing home. For example, in 2012 the median price of an existing Twin Cities home was $177,900, while the average price of a new home was $287,352. So far this year, the median price of an existing home has been $224,900 and the average price of a new home is $330,466.
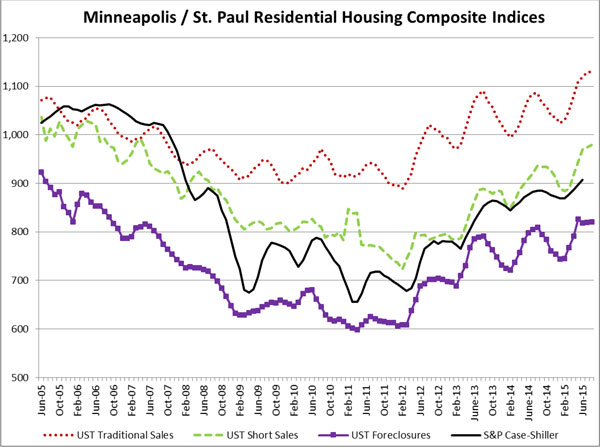
The St. Thomas indexes.
Here are the Shenehon Center’s monthly composite index scores for August 2015. The index, which tracks nine data elements for the three types of sales (traditional, short sales and foreclosures), started in January 2005. For that month, the center gave each of the three indexes a value of 1,000.
The August 2015 index score for traditional sales was 1,129, up one point from July 2015. The August score is the highest since the index began in 2005 and is up 4.06 percent from August 2014.
The August 2015 index score for short sales was 979, up five points from July 2015 and up 4.71 percent since August 2014.
The August 2015 index score for foreclosures was 820. That’s unchanged from July 2015 and up 1.23 percent since August 2014.
More information online
The Shenehon Center’s charts and report for August can be found on the center’s website here.
The index is available free via email from Tousley at hwtousley1@stthomas.edu.