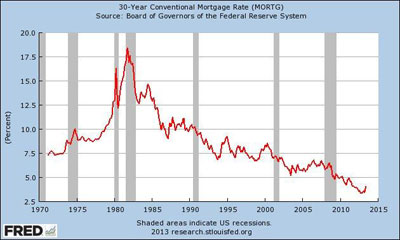
This chart shows mortgage rates since 1970; while they've gone up in recent months, they are still historically low.
Will the recent rise in interest rates derail the Twin Cities’ housing-market recovery?
Probably not, according to the Residential Real Estate Price Report Index, a monthly analysis of the 13-county metro area prepared by the Shenehon Center for Real Estate at the University of St. Thomas’ Opus College of Business.
In his analysis for the month of June, Herb Tousley, director of real estate programs at the university, said that while mortgage rates recently have increased about 1 percent, they are still historically very low.
“If rates increase slightly and it happens gradually, it should not derail the housing recovery,” Tousley predicted. “Even with a small interest rate increase, a family with a median household income would still be able to afford a median-priced Twin Cities home.”
A chart showing housing-affordability calculations in today’s market can be found on the Shenehon Center’s website and below. The chart’s bottom line shows that a median-income family would have $1,433 available for housing, while the total payment, including insurance and taxes, would be $1,283.
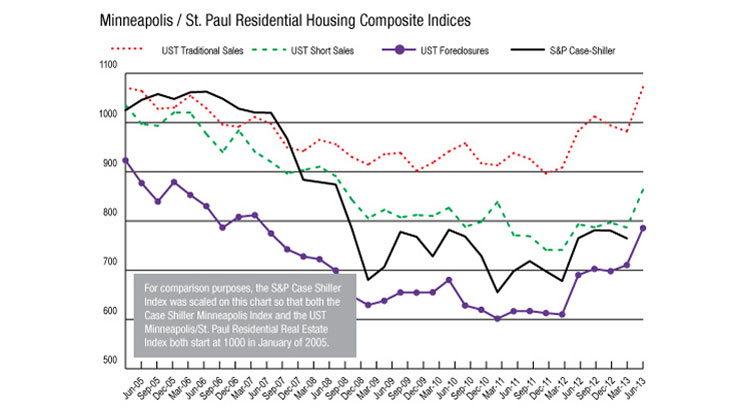
Each month the center tracks nine housing-market data elements, including the median price for three types of sales: nondistressed or traditional-type sales, foreclosures, and short sales (when a home is sold for less than the outstanding mortgage balance).
Overall, the median sale price for a Twin Cities home increased 5.4 percent from May to June, marking the fifth-consecutive monthly increase. The median price of a nondistressed home in June 2013 was $232,000; that’s up 8.7 percent over June of 2012 and is only 3.3 percent less than the all-time high of $239,900 that was recorded in June 2006, prior the burst of the housing bubble.
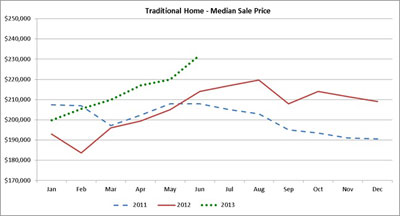
The green dots indicate the 2013 median sale price for a Twin Cities home. The prices are well above the 2012 prices in red and the 2011 prices in blue.
The proportion of distressed sales (foreclosures and short sales) continues to decline. In June, only 22 percent of closed sales were distressed; that’s the lowest percentage since January 2008.
The number of new listings and pending sales declined slightly in June, following normal seasonal patterns. While historically low, the inventory of homes for sale is improving.
“It appears that the inventory of homes for sale bottomed out in January 2013, at 12,919,” Tousley said. “It has increased every month since then, ending in June at 15,523 homes for sale.”
In June there were 2.8 homes on the market for every home sold. That low ratio (in a balanced market it usually ranges from 6 to 8) indicates the demand is strong and the inventory is somewhat constrained. “This is good news for sellers since it indicates that there will continue to be upward pressure on median sale prices for several months to come,” Tousley said.
That low inventory also creates opportunities for homebuilders. According to the Keystone Report, construction permits for new single-family homes in the metro area are up 29.7 percent for the first half of 2013 compared to the first half of 2012. June saw 478 new permits for homes in the Twin Cities. While permits are running far behind levels seen in 2005 and 2006, homebuilders are in the midst of a second year of steady growth.
St. Thomas’ real estate index, the one that uses nine data elements to measure the health of the market, showed month-to-month and year-to-year increases in June for the three categories of sales. For traditional sales, the June index is up 9.28 percent over last year; for short sales, the index is up 8.95 percent; and for foreclosure sales, the index is up 14.91 percent.
Research for the monthly reports is conducted by Tousley and Dr. Thomas Hamilton, associate professor of real estate at the university. The index is available free via email from Tousley at hwtousley1@stthomas.edu.
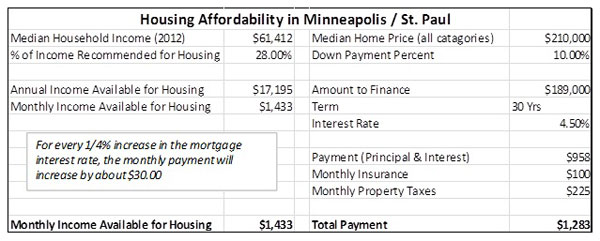
This worksheet shows that home with a median price could be purchased by a household with a median income.