Calling it an “optimistic forecast,” researchers at the University of St. Thomas today said the mood of Twin Cities holiday shoppers this year resembles that found prior to the recession-dampened holidays of 2008 and 2009.
The 10th annual University of St. Thomas Holiday Spending Sentiment Survey has been conducted in late October since 2002 and now provides a decade’s worth of longitudinal data on Twin Cities holiday shopping trends.
The survey measures the intent of Twin Cities shoppers: how much they think they will spend for holiday gifts, what they will spend it on, and where they will spend it. The research is conducted by Dr. Lorman Lundsten, Dr. Dave Brennan and Dr. John Sailors at St. Thomas’ Opus College of Business.
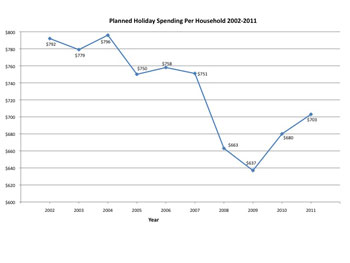
According to the survey, household spending for holiday gifts is predicted to be 3.4 percent more in the Twin Cities this year than last. Data shows that a decline in holiday spending began in 2007, but was especially pronounced in 2008 when shoppers said they were trimming budgets by more than 10 percent. The turnaround began in 2010, with a predicted 8 percent uptick, and continued this year.
According to the survey, 31 percent of shoppers said they would spend less this year. That is significantly less than the 54 percent who said they’d shop less back in 2008 and 2009, but is similar to pre-recession levels. Meanwhile, 10 percent said they would spend more this year; that is more than double the 4 percent who said they’d shop more in 2008 and also similar to the pre-recession levels.
This year's predicted household spending for holiday gifts, $703, compares to last year’s $680. Over the past 10 years, the lowest was $637 in 2009 and the highest was $796 in 2004.
In its first eight years, the St. Thomas study has mirrored or painted a slightly more pessimistic shopping picture than national surveys. For the past two years, St. Thomas’ data has been slightly more optimistic. The university’s predicted increase in household spending of 3.4 percent compares to the nationally projected increases by Deloitte & Touche at 2.5 to 3 percent, the National Retail Federation at 2.8 percent and the International Council of Shopping Centers at 2.2 percent.
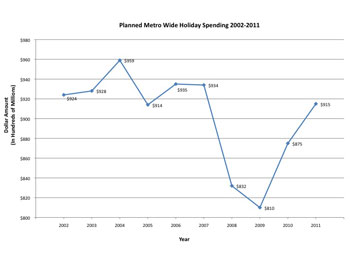
Based on the survey responses and the population of the greater Minneapolis-St. Paul metro area, the researchers predict that the metro-region shoppers will cumulatively spend $915 million this year, up 4.6 percent from last year's predicted $875 million. The highest was a predicted $959 million in 2004.
A peek under the tree
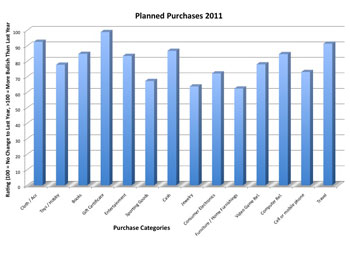
What will Twin Cities shoppers buy with their $703? The professors created an index to analyze the relative popularity of 14 gift categories. It sheds light on the “what’s hot” question and allows year-to-year comparisons.
The categories -- listed by most-popular first -- are: gift certificates, clothing and accessories, travel, cash, books, computers and related items, entertainment, video games and related items, toys and hobbies, cell/mobile phones, consumer electronics, sporting goods, jewelry, and furniture and home furnishings.
That's close to last year, but there have been some changes. Gift certificates have reigned supreme for the past four years, but books slumped from No. 2 last year down to No. 5 this year, a move that could be related to e-book readers and tablets.
The researchers added a new category this year, “travel,” and it wound up in third place.
Categories that moved up in the relative standings this year were clothing (from 3 to 2), cash (from 6 to 4), video games (from 9 to 8), computers (from 8 to 6) and cell phones (from 12 to 10).
Categories that moved down were toys (from 5 to 9), books (from 2 to 5), entertainment (from 4 to 7), sporting goods (from 10 to 12), consumer electronics (from 7 to 11), and furniture (from 11 to 14). Jewelry didn’t change; it remains near the bottom at No. 13.
Where they spend
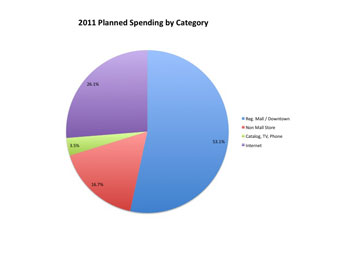
For the past 10 years the survey has asked shoppers where they plan to spend their money. This year's results bode well for shopping malls (but not for non-mall stores) and continue to reinforce a gradual trend toward the Internet and away from catalogs.
Respondents plan to spend 53.1 percent of their budget at 14 regional malls and shopping areas. That’s up significantly from the 10-year low of 36.2 percent as recently as 2008.
They will spend 16.7 percent of their budget at non-mall stores this year, a marked decrease from 27.4 percent last year and a 10-year high of 39.2 percent in 2008.
This year, shoppers plan to spend 26.1 percent of their holiday budget using the Internet. That's up from 21.8 percent last year, and is more than three times the 7.3 percent reported in 2002 when the surveys began. That compares to 3.5 percent of shoppers this year who will use catalogs, a category that has seen a gradual decline since 2002. That year, catalogs outpaced the Internet 9 percent to 7.3 percent.
What kind of Internet sites are most popular with shoppers? To find out, the researchers asked respondents to indicate what portion of their spending would be done on four kinds of online sites. “Bricks and Clicks” sites, operated by stores like Target, received 38.2 percent of the online spending. “Internet Only” sites, like Amazon, were close behind at 37.5 percent. “Deals” sites, like Groupon, registered 7.7 percent, and “Broker-Facilitator” sites, like eBay, registered 5.4 percent.
This year, respondents were asked to list two stores and two websites where they planned to shop. There were clear favorites in both categories.
In the store division, Target was mentioned nearly twice as often as second-place Macy’s. Next in line were JC Penney, Kohl’s, Best Buy, Walmart, Herberger’s, Barnes & Noble, Sears and Nordstrom.
In the online division, Amazon was mentioned seven times more often than second-place eBay. Next in line were Target, Barnes & Noble, Craigslist, Macy’s, JC Penney, Groupon, Toys R Us and Walmart.
Most-popular malls and shopping areas
Which of the malls and shopping areas (including the two downtowns) are going to attract the most shoppers?
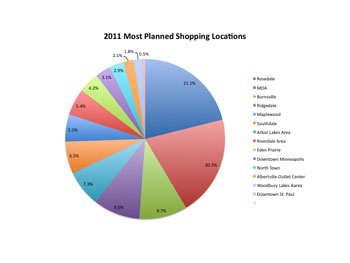
The researchers approached that question from two perspectives: first, which mall in the region are metro-area consumers planning to visit for holiday shopping; second, which mall are they planning to shop at most for the holidays. The results are not the same.
Some changes were made to the list this year. Brookdale was dropped after much of the mall was closed and demolished this summer. Four shopping areas -- Albertville Outlet Center, Arbor Lakes Area, Riverdale Area and Woodbury Lakes Area -- were added to the mix.
When asked which malls or downtowns they planned to visit for their holiday shopping this year, survey respondents listed, from most-popular to least-popular: Mall of America, Rosedale, Southdale, Maplewood and Burnsville (tie for fourth), Ridgedale, downtown Minneapolis, Arbor Lakes Area, Northtown, Eden Prairie, Riverdale Area, Albertville, Woodbury Lakes and downtown St. Paul.
The Mall of America, Rosedale, and Southdale held these one-two-three rankings last year, as well as 10 years ago. The Mall of America has been the top “holiday shopping” mall for all 10 years of the survey with the exception of 2004-2006 when Rosedale was No. 1.
When asked where they planned to do most of their holiday shopping this year, respondents listed, in order: Rosedale, Mall of America, Burnsville, Ridgedale, Maplewood, Southdale, Arbor Lakes, Riverdale, Eden Prairie, downtown Minneapolis, Northtown, Albertville, Woodbury Lakes, and downtown St. Paul.
In the most-shopped category, the Mall of America was in sixth place in 2002 but has been in second the past two years, and was first in 2009. Rosedale has been in first place every year except 2009, when it was fourth. The biggest changes this year saw Southdale drop from fourth to sixth, downtown Minneapolis drop from seventh to 10th, and Northtown drop from sixth to 11th. The biggest gain was seen by Burnsville, which went from sixth to third. Downtown St. Paul has been at the bottom since the survey began.
What the research data tells us
“There is good reason to be optimistic about the results of this year’s data,” Brennan said. “If we look at the findings from the past 10 years, we can see shoppers’ optimism in the early days of the survey, then the concerns and cutbacks due to the recession, and for the past two years a return to the kind of outlook shoppers had back in 2006 and 2007. The trend now is a return to a pre-recession shopping mood.”
Sailors feels the Twin Cities market is ahead of the country as a whole when it comes to a rebound. “To see us snapping back faster and further makes sense,” he said. “We are not like some regions that have been hit especially hard. The majority of Minnesotans are employed; how long can you expect them to wait until they return to normal spending patterns?”
“And while this survey covered the metro area, I think outstate Minnesota should do well this year as well,” Brennan said. “The corn and bean prices are up, and this should be a good year for farmers.”
An example of returning consumer confidence can found in the list of the “most-popular” gift categories. A “travel” category was added for the first time this year. It can’t be compared to earlier years, but as Brennan noted, “that it came in third indicates that people are feeling better and are more confident. They are making plans.”
At a time when survey results show that malls are more popular than ever, Brennan noted that the Mall of America had an especially good showing this year. It increased its lead over Rosedale as a spot to go at least once this holiday season, and wasn’t far behind Rosedale as the place where respondents planned to do the bulk of their shopping.
What about big holiday sales this year? Lundsten said retailers learned a lesson in 2008 and are keeping inventories lower this year. “There even could be shortages of some items. I don’t see a return of huge, across-the-board sales this year. I would look for more targeted sales and promotions that will help keep people coming into the stores.”
While there have been some early holiday promotions, like Walmart’s layaway plan, the St. Thomas professors haven’t noticed as much “Christmas creep” as some years, and especially in 2009.
“If you start promoting holiday sales too soon, you could miss events like Halloween and Thanksgiving sales,” Lundsten noted.
Respondents completed the surveys the first week in November, and at that point indicated they already had completed 17 percent of their shopping. They predicted they will have completed 53 percent of their shopping by Dec. 1.
“There’s going to be a lot of spending in December,” Brennan said.
The three professors who conducted the study emphasize that actual spending might be different because shoppers could spend more or less than they planned once they get into the stores.
The researchers
Lundsten and Brennan are both longtime members of the Opus College of Business faculty. Sailors joined the faculty in 2005.
Lundsten is a professor of marketing and chairs the university’s Marketing Department. He holds a doctorate from the University of Michigan.
Brennan, who holds his Ph.D. from Kent State University, is a professor of marketing and co-director of the university’s Institute for Retailing Excellence.
Sailors is a specialist in consumer behavior, marketing research, and brand equity and loyalty; his doctorate is from Northwestern University.
The Institute for Retailing Excellence, part of the St. Thomas Opus College of Business, conducts research and offers educational programs for those who work in retailing.
Survey method
This year’s holiday spending survey included 358 responses from households in the 13-county Minneapolis-St. Paul Metropolitan Statistical Area, which includes two counties in western Wisconsin.
The respondents reflect the demographics of the area as well as those who responded to previous holiday spending surveys. There were, however, more female respondents (82.8 percent) than usual this year.
