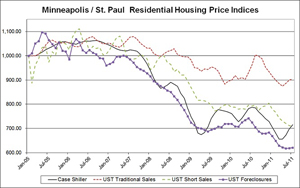
The median sale price for a nonforeclosed home in the 13-county Twin Cities market has fallen considerably less than the median price for all homes reported by the widely used Standard and Poor’s Case-Shiller Home Price Index, according to figures released today by the Shenehon Center for Real Estate at the University of St. Thomas’ Opus College of Business.
The St. Thomas Residential Real Estate Price Report Index, now in its fourth month, was developed to provide a more detailed analysis of the Twin Cities residential real estate market than is available from the Case-Shiller Home Price Index.
The Case-Shiller index does not distinguish between a traditional, normal market sale and a distressed sale. The St. Thomas index provides data for all sales, but in addition it distinguishes between traditional sales, short sales (homes sold for a price less than the outstanding mortgage balance), and sales where the home’s mortgage has been foreclosed.
Going back to early 2005, near the height of the housing-price bubble, the Case-Shiller index for the Twin Cities has reported an overall decline in market price of 28.4 percent. The St. Thomas index for traditional housing sales for that same period shows a price decline of 9.5 percent. Over that period St. Thomas also found a 29 percent decline for short-sale homes and a 38 percent decline for foreclosed homes.
“Combining foreclosure and short sales of real estate with traditional property sales skews any single, composite price index, such as Case-Shiller’s, and creates a downward bias when foreclosure sales and short sales represent a significant part of total housing sales,” explained Herb Tousley, director of real estate programs at St. Thomas.
“In a normal housing market, less than 5 percent of properties would be classified as distressed,” he said. “During the last few years foreclosure and short sales have comprised between 35 percent and 60 percent of all housing sales. This unusually high disproportionality of distressed sales causes the reported decline in a single, overall housing price index to be overstated.”
In addition to looking back to the 2005 peak of the housing bubble, the St. Thomas index provides month-to-month and year-to-year comparisons of the various categories of home sales. It also has created an overall index that uses nine data elements to measure the health of the Twin Cities housing market.
The index revealed some mixed news for September. Compared to the previous month, the median price of a Twin Cities traditional-sale home dropped 4.6 percent, from $195,000 in August to $186,000 in September. The short-sale price dropped less than a percent, from $131,000 to $129,900, while the price for a foreclosed home increased 6.7 percent, from $96,900 to $103,400.
September marked the third-consecutive decrease for traditional-sale homes. The good news is that compared to a year ago, the number of sales is up (26 percent); the supply of homes on the market is down (24.7 percent) and the time on the market increased (4.6 percent or six days).
“More sales and a declining supply of homes for sale are indicative of a stabilizing housing market as sales activity increases and excess inventory is absorbed,” Tousley said. “These are prerequisites to return the residential real estate market to more stable conditions.”
When comparing September 2011 with September 2010, St. Thomas’ composite index (the one based on nine Twin Cities data elements) showed a 6 percent decline for both traditional and foreclosure sales, and a 4 percent decline for short sales.
Charts and more details can be found on the Shenehon Center’s website. A free, monthly index via e-mail is available from Tousley at hwtousley1@stthomas.edu.
Research for the St. Thomas index was conducted by Tousley and Dr. Thomas Hamilton, associate professor of real estate at the university.


